Do you have some SQL practice? Do you want to take up a challenge? Have fun and learn several advanced Data Science techniques. 3 Articles.

Photo by KOBU Agency on Unsplash
The trick is:
- BigQuery, a tool for Big Data and Analytics from Google Cloud, has a free environment and offers many Open Data, checked and updated regularly.
- It is much easier to understand concepts with engaging analysis and investigation. COVID is a sad topic, but for sure you are informed and interested. First rule: feel the data.
- All this offers a good chance for learning advanced techniques, Analytics, Data Science and Machine Learning in an easy way.

So, we are about to work empirically with this data, without formulas and theories. With an experimental, multimedia strategy.
We start with a challenge. Ready to go?
- You will use BigQuery in the Sandbox version, free and without any credit card data.
Here a short video of the tool.
- You will become familiar with the environment and connect to the global data of COVID-19 (continuously updated without the need for action on your part).
- You will then face the challenge; if you are an expert in SQL you will solve it, otherwise you will have the opportunity to learn some advanced SQL.
I disclose to you now the challenge to solve:
Compute the ranking of the 5 most affected countries (in the world) each month, starting from January 2020. In 1 SQL Statement.
Following you will find all the instructions to get started.
The next articles (links at the bottom) will explain the solution and the next steps.
Environment and data
Enter the Google Cloud https://console.cloud.google.com/
If you don’t have an account don’t accept the 300$ credit and just get in.
Don’t give your credit card data.

Enter the BigQuery sandbox environment. Detailed description here, if you want to know how Sandbox works.

We need first to access public data about COVID:
Add Data → Public Datasets → COVID-19 Open Data→ View Dataset

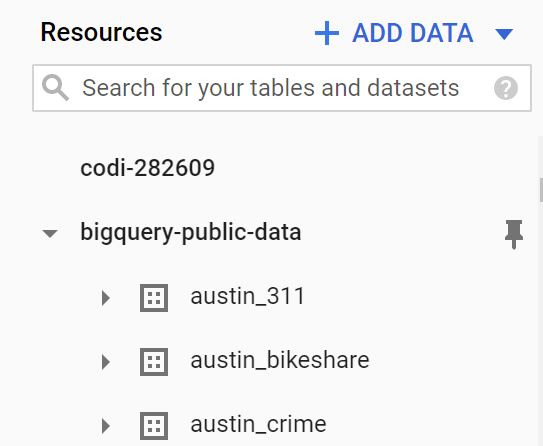
On the Bigquery screen you will see your project (mine is codi-282609) and then bigquery-public-data.
Don’t ask me why it tells you to choose a dataset and then it gives you all of them anyway….Mystery.
Select covid19_ecdc and covid_19_geographic_distribution_worldwide and look at the schema/preview so to familiarize with data:

We have for each (day+country) the number of new cases and inhabitants.
Results that we want to compute
We want to compute the ranking of the 5 most affected countries (in the world) each month, starting from January 2020.
Something like this:

Most affected means with the greater number of cases, any seriousness. Obviously in relation to the population.
Analyzing results you will be amazed! Different from what you would think …
Challenge!
How would you get the required result?
We don’t need to use any coding and one SQL Statement will be enough.
UP TO YOU! TRY and PLAY with us.
Next article will give (my) solution. I hope your method will be better than mine!
Visual Recap

.jpg)


.png)
.jpg)